
Healthy Fat & BMI Ranges for Males & Females | Body Metrics
6th Oct 2024
Understanding Healthy Body Fat, BMI and Fitness Measurements
Before we begin, let us preface with this: no number is a complete picture of your overall health.
Data can give you an idea to help you understand your health and then find ways to get healthier, but the general formulas you find online often give you a standard, without being overly personalised.
This can be damaging as we’re all different and many factors come into play when determining our health. For example, your body fat percentage depends on variables such as your age, sex and activity level, but this is just one way to assess your body composition.
There are other body metrics men and women use to monitor their health, so this article will briefly cover a range of them and tell why they’re important in your weight management or fitness journey.
Jump there now:
- How to Take Body Measurements for Fitness
- Body Fat Percentage
- Body Mass Index (BMI)
- Bone Mass
- Body Water Percentage
- Muscle Mass
- End Note
Definition: Your body composition is your percentage of fat, muscle, water and bone.
You can measure your body composition by buying scales that have Bioelectrical Impedance Analysis (BIA) built in — many gyms have these, too!
While not totally accurate, it can help you get an idea of your body metrics, just make sure you use it when you’re well-hydrated and before a strenuous workout. Make sure to use it at the same time each day, too, and to stand tall and relaxed while on the scale.
Once you have your numbers, we then need to work out what they all mean!
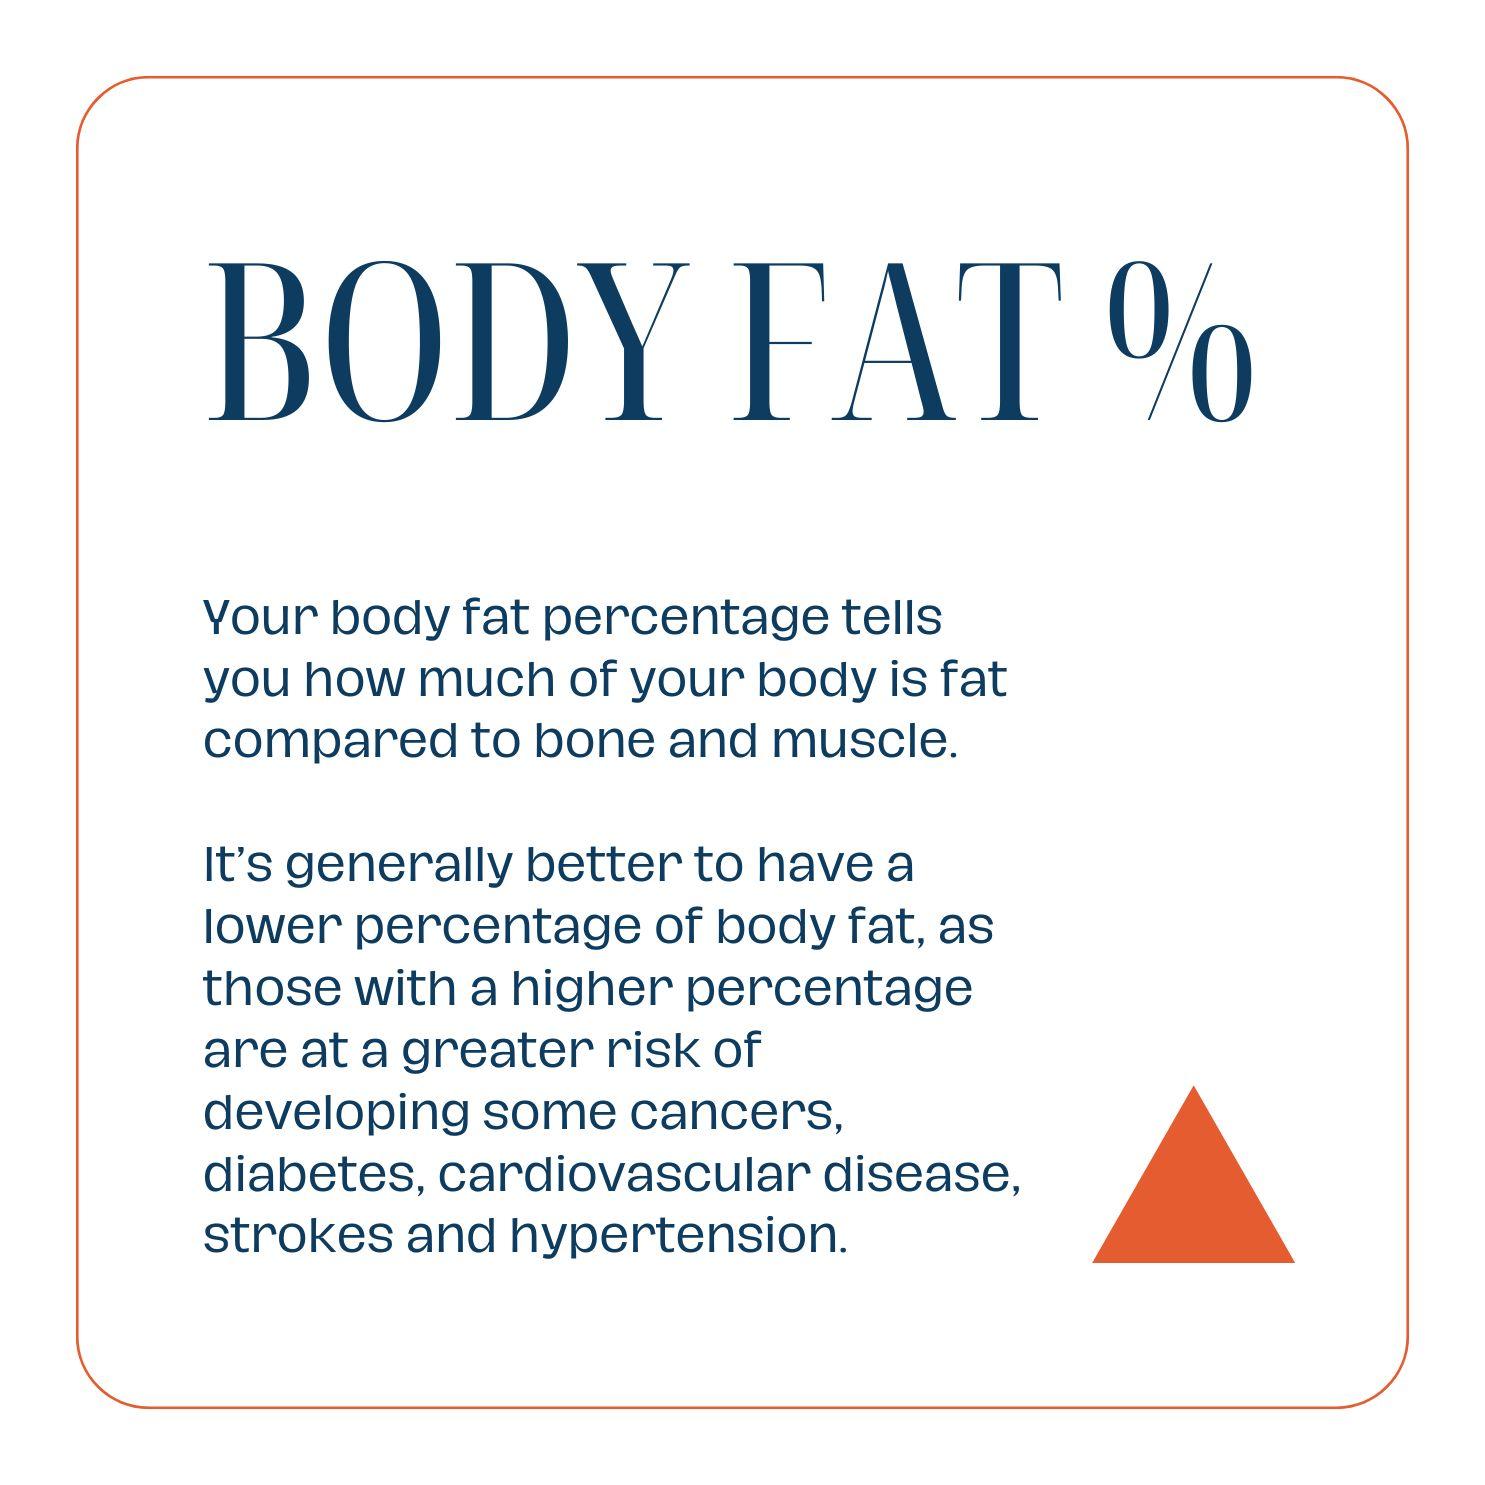
Your body fat percentage tells you how much of your body is fat compared to bone and muscle.
It’s generally better to have a lower percentage of body fat, as those with higher are at a greater risk of developing some cancers, diabetes, cardiovascular disease, strokes and hypertension.
Body fat percentage charts for women and men are often divided by categories or age, but what is a healthy fat range for both males and females?
Women: require a higher fat percentage due to reproduction.
Categories:
- Essential Fat: 10–13%
- Athletes: 14–20%
- Fitness: 21–24%
- Acceptable: 25–31%
- Obesity: more than 32%
Age:
- 20–39: 21–32%
- 40–59: 23–33%
- 60–79: 24–35%
Men: have a lower body fat-to-lean tissue ratio than women.
Categories:
- Essential Fat: 2–5%
- Athletes: 6–13%
- Fitness: 14–17%
- Acceptable: 18–24%
- Obesity: more than 25%
Age:
- 20–39: 8–9%
- 40–59: 11–21%
- 60–79: 13–24%
If looking for a body fat percentage calculator, there are many ways to calculate your body fat percentage, but a common method is by using skinfold callipers. While you can do it yourself, having a training professional do it for you will give you a more accurate result. While less accurate, you can also use body fat scales and body circumference measurements to help you track your progress.
Further Reading: How Spermidine Can Help with Weight Loss
People often ask, ‘What is the normal body mass index for a man and a woman?’ but there’s a bit more to it than that.
BMI is a measure of your weight (in kilograms) in relation to your height (in metres).
This is a general guideline to help determine if a person is underweight, healthy weight, overweight or obese, but it doesn’t consider your personal circumstances. For example, it can suggest that bodybuilders and pregnant women are overweight while suggesting that the elderly or some people with physical disabilities are underweight.
It’s important to note that BMI doesn’t recognise the difference between body fat and muscle mass. It’s also not totally accurate if you’re very short or very tall and isn’t accurate for all ethnicities, such as those of Asian or Islander descent.
You can find a BMI calculator online (keeping in mind that those under 20 require different calculators), but here are the general categories that correspond with BMI ranges:
- Underweight: 18.5
- Healthy Weight: 18.5–24.9
- Overweight: 25–29.9
- Obese: 30 and above
Further Reading: White vs. Brown Fat
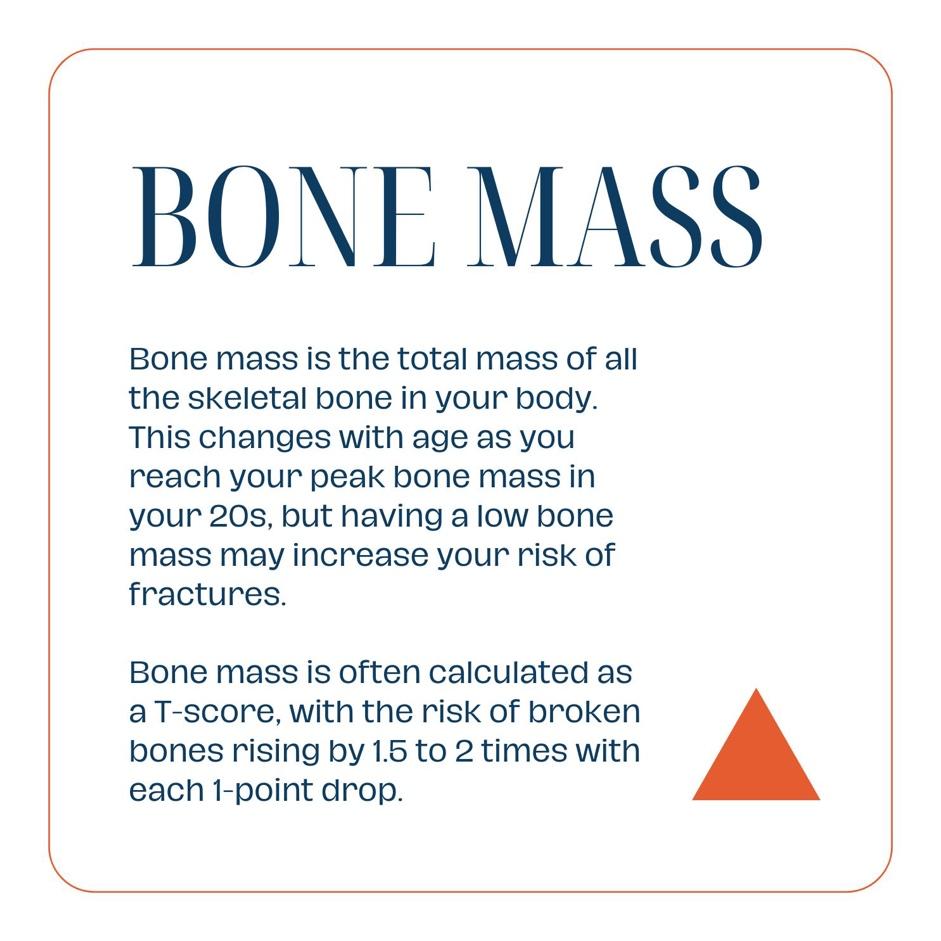
Bone mass is simply the total mass of all the skeletal bone in your body. This changes with age as you reach your peak bone mass in your 20s but having a low bone mass may increase your risk of fractures.
Bone mass is often calculated as a T-score, with the risk of broken bones rising by 1.5 to 2 times with each 1-point drop.
- Healthy: T-1
- Osteopenia: T-1 to -2.5
- Osteoporosis: T-2.5 or lower
How much of your body mass is fluid depends on your age, sex and hydration but, generally, too much water can be an indication of heart, liver or kidney disease or malnutrition.
- Men: 50–65%
- Women: 45–60%
While your body has three types of muscle (skeletal, smooth and cardiac), skeletal muscle is the one we measure as it’s the one we can easily control. A higher muscle mass can help you prevent illnesses and falls as well as increase your metabolic rate. Muscle mass percentage is often categorised by age:
What is the average muscle mass for men:
- 20–39: 75–89%
- 40–59: 73–86%
- 60–79: 70–84%
What is the average muscle mass for women:
- 20–39: 63–75.5%
- 40–59: 62–73.5%
- 60–79: 60–72.5%
Further Reading: Role of Exercise in Weight Loss
Speak to your doctor, certified personal trainer or registered dietitian for any questions or for how to use these body measurements in your weight loss or management journey.
While these measurements can be useful, they shouldn’t be your main target in your weight loss journey. Focus on eating nutritious food, drinking plenty of water, getting enough water, reducing your stress levels and getting adequate sleep to help improve your health span and well-being.
If you need help in your weight loss journey, supplements may also help alongside these lifestyle changes. Lean XP, for example, helps burn visceral body fat, helps with faster fat reduction after workouts and improves your metabolism!